
App Analytics for App Founders: What to Measure and Why It Matters
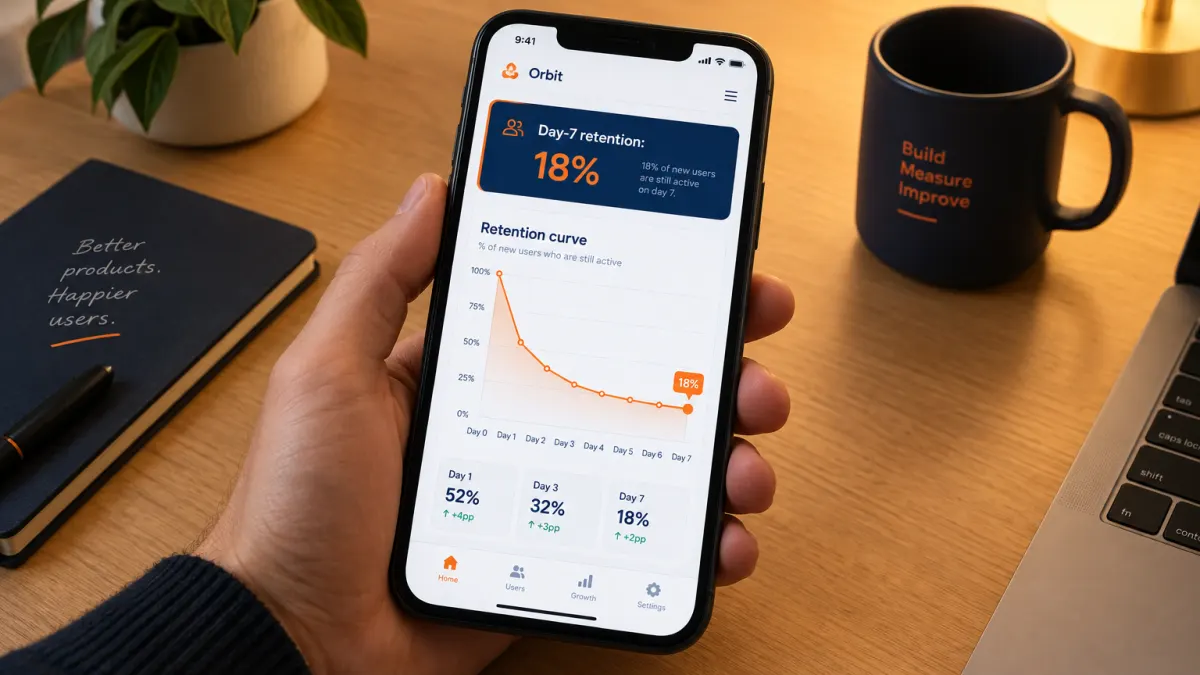
App analytics is the practice of measuring what users do inside your app: which features they use, where they drop off, and whether they come back. For a B2C app founder, analytics is not a reporting exercise. It is the only way to know whether the users your marketing brings in are actually staying.
Most channel tools stop at installs. App analytics starts there and asks the harder question: what happened next?
What Does App Analytics Measure?
App analytics tracks user behavior from the moment someone opens your app. The core things it measures:
- Installs and first opens: how many people downloaded and launched the app
- Activation: whether a new user completed the action that makes the app useful to them (creating an account, finishing onboarding, sending a first message, or whatever your “aha moment” is)
- Retention: what percentage of users return on day 1, day 7, and day 30 after install
- Engagement: which features users interact with, how often, and for how long
- Churn: when users stop returning and what they did (or did not do) before they left
- Conversion: for apps with a paid tier, how many users move from free to paid and at what point in their journey
Each of these metrics answers a different question. Installs tell you whether your marketing is reaching people. Retention tells you whether your app is worth coming back to. Activation sits in between. It is often the single metric that predicts whether a new user will still be there in a month.
Why Retention Is the Metric That Matters Most for App Growth
An install that does not lead to a returning user is a cost, not a result. Acquiring a user who churns in 48 hours means you paid for nothing, whether in time, ad spend, or content effort.
Retention is the metric that separates sustainable app growth from a leaky bucket. If your day-7 retention is low, more installs will not fix it. You will keep spending to replace users who leave at the same rate.
This is why app analytics needs to be connected to your marketing, not siloed from it. When you know which channel or which piece of content brought in your highest-retention users, you can put more effort there and less effort everywhere else. That is the difference between marketing that grows an app and marketing that fills a spreadsheet.
Which App Analytics Metrics Should an Early-Stage Founder Track?
Early-stage founders do not need a dashboard with 40 metrics. They need a short list of numbers that tell them whether the app is working and whether the marketing is working.
Start with these five:
-
Day-1 retention: Did the user come back the day after they installed? A healthy benchmark for consumer apps is roughly 25–40%. Below 20% is a signal that onboarding or the core loop needs attention before you scale marketing.
-
Day-7 retention: Still using the app a week later? This is a stronger signal of genuine habit formation. Consumer app averages sit around 10–20% at day 7.
-
Activation rate: What percentage of new users complete your defined activation event? If this is below 50%, most of your installs are not reaching the moment that makes your app valuable.
-
Install source: Where did each install come from? Without this, you cannot know which marketing channel is worth continuing.
-
Retention by install source: Which channel brought in users who stayed? This is the number that most channel tools never show you, and it is the one that should drive your next week’s marketing decisions.
You do not need to track all of these manually. Tools like Amplitude, Mixpanel, and Firebase Analytics can surface these numbers automatically once you instrument your app with the relevant events.
How App Analytics Should Drive Your Marketing Decisions
Analytics without action is just data. The point of measuring user behavior is to change what you do next week.
Here is a simple decision loop that works for early-stage apps:
- Measure: track installs, activation, and day-7 retention by source
- Compare: identify which channel or content type brought in users with the highest retention
- Shift: put more effort into the highest-retention source; reduce or pause the lowest
- Repeat: run the same comparison the following week with the new data
This loop does not require a data team. It requires that your analytics tool is connected to your marketing activity, with every post, every email, and every ad tagged so you can trace it back to the users it brought in and what those users did afterward.
Most marketing tools do not do this. They report on clicks and installs and stop there. The connection between a specific piece of content and whether the users it drove are still in your app 30 days later is almost never surfaced automatically. That gap is where most early-stage app marketing budgets are wasted.
Marketing That Measures Who Stays, Not Just Who Clicks
Appcmo is an AI CMO built for B2C app founders who do not have a marketing team. It plans and runs marketing across social, SEO, and app stores, and it measures results through your own Amplitude analytics, connecting each post to the installs it drove and to what those users did in the app afterward.
The goal is not more installs. It is more users who stay.
Appcmo is currently invite-only. If you are building a B2C app and want marketing that runs on about 30 minutes a week of your attention, join the waitlist.
Join the waitlist →Frequently asked questions
What is app analytics?
App analytics is the measurement of user behavior inside a mobile or web app, including installs, activation, retention, engagement, and churn. It tells you what users do after they open your app, not just whether they downloaded it.
What is the most important metric in app analytics?
For most early-stage B2C apps, day-7 retention is the most important single metric. It shows whether users are forming a habit with your app. A low day-7 retention rate means scaling your marketing will not produce sustainable growth.
What is a good retention rate for a mobile app?
Consumer app benchmarks vary by category, but a commonly cited range for day-1 retention is 25–40%, and for day-7 retention is 10–20%. Below 20% on day 1 or below 10% on day 7 is a signal to address onboarding or the core product loop before increasing marketing spend.
What tools are used for app analytics?
Common app analytics tools include Amplitude, Mixpanel, and Firebase Analytics (Google). Each can track user events, retention curves, and funnel completion once you instrument your app with the relevant event calls.
How does app analytics connect to marketing?
App analytics connects to marketing when each install is tagged with its source: the channel, post, or campaign that drove it. With source tagging in place, you can compare retention rates across channels and shift effort toward the marketing that brings in users who stay.
Do I need a data team to use app analytics?
No. Early-stage founders can track the five metrics that matter most (day-1 retention, day-7 retention, activation rate, install source, and retention by source) using a single analytics tool without a data team. The key is instrumenting your app with the right events from the start.